iyziTrace
Your system already knows the answer.
IyziTrace helps you hear it.

Why IyziTrace

Know what broke, what it affects, and what to do next.

IyziTrace is OpenTelemetry-native APM that traces an incident to its root cause, shows which services it puts at risk, and connects your team to the response.

  • OpenTelemetry native
  • Built on Grafana
  • AI Investigations
  • MCP-connected
  • SaaS & On-premises

The challenge

Most incidents aren't hard to see. They're hard to understand.

The alert fires in seconds. Finding the cause and the impact takes hours.

  • Scattered signals

    Traces, logs, metrics and dependencies live in different tools. Every investigation starts by switching between them.

  • No view of the impact

    An alert names one unhealthy service. It doesn't say which applications and workflows will fail with it.

  • Green dashboards, broken checkout

    Every service reports healthy while customers can't log in, check out or pay.

  • Costs you can't forecast

    Licensing tied to cores, memory, data volume and add-on features grows faster than the systems you monitor.

Why organizations choose IyziTrace

Five reasons to choose IyziTrace

Each one answers a question your current tools leave open.

  1. Nexus

    See the blast radius, not just the alert

    Nexus combines observed service relationships with your infrastructure inventory to show what a failure puts at risk:

    • Affected services and upstream dependencies
    • Shared databases, caches, queues and messaging systems
    • Declared dependencies compared with observed ones, including those with no telemetry behind them
    • How a failure can spread across connected services

    Know what could break next, not just what broke first.
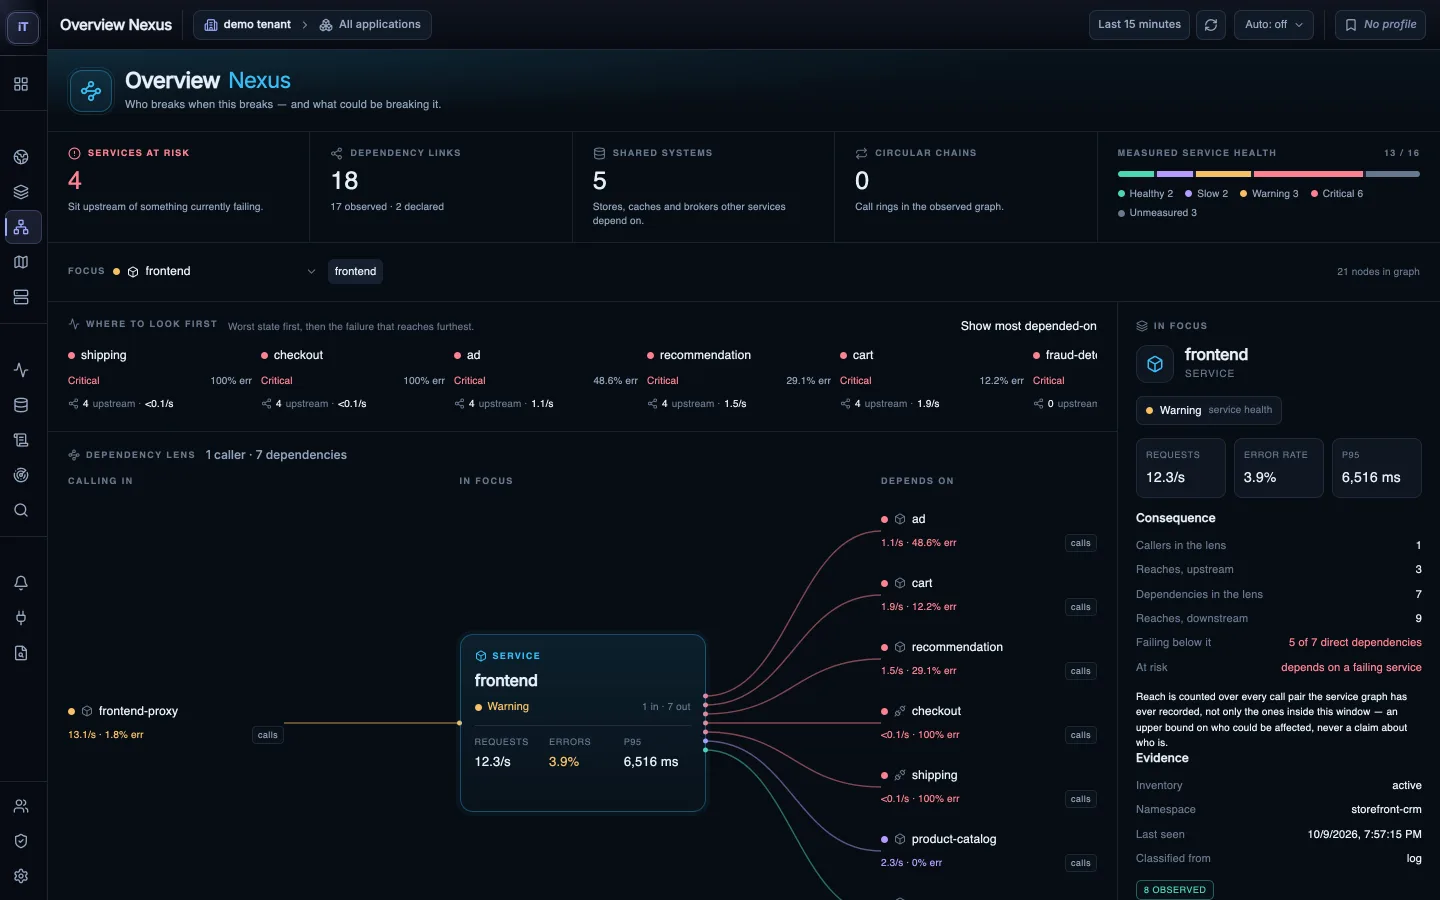
    Nexus showing the services that call a selected service and the ones it depends on
  2. AI Investigations

    From alert to root cause, with the evidence attached

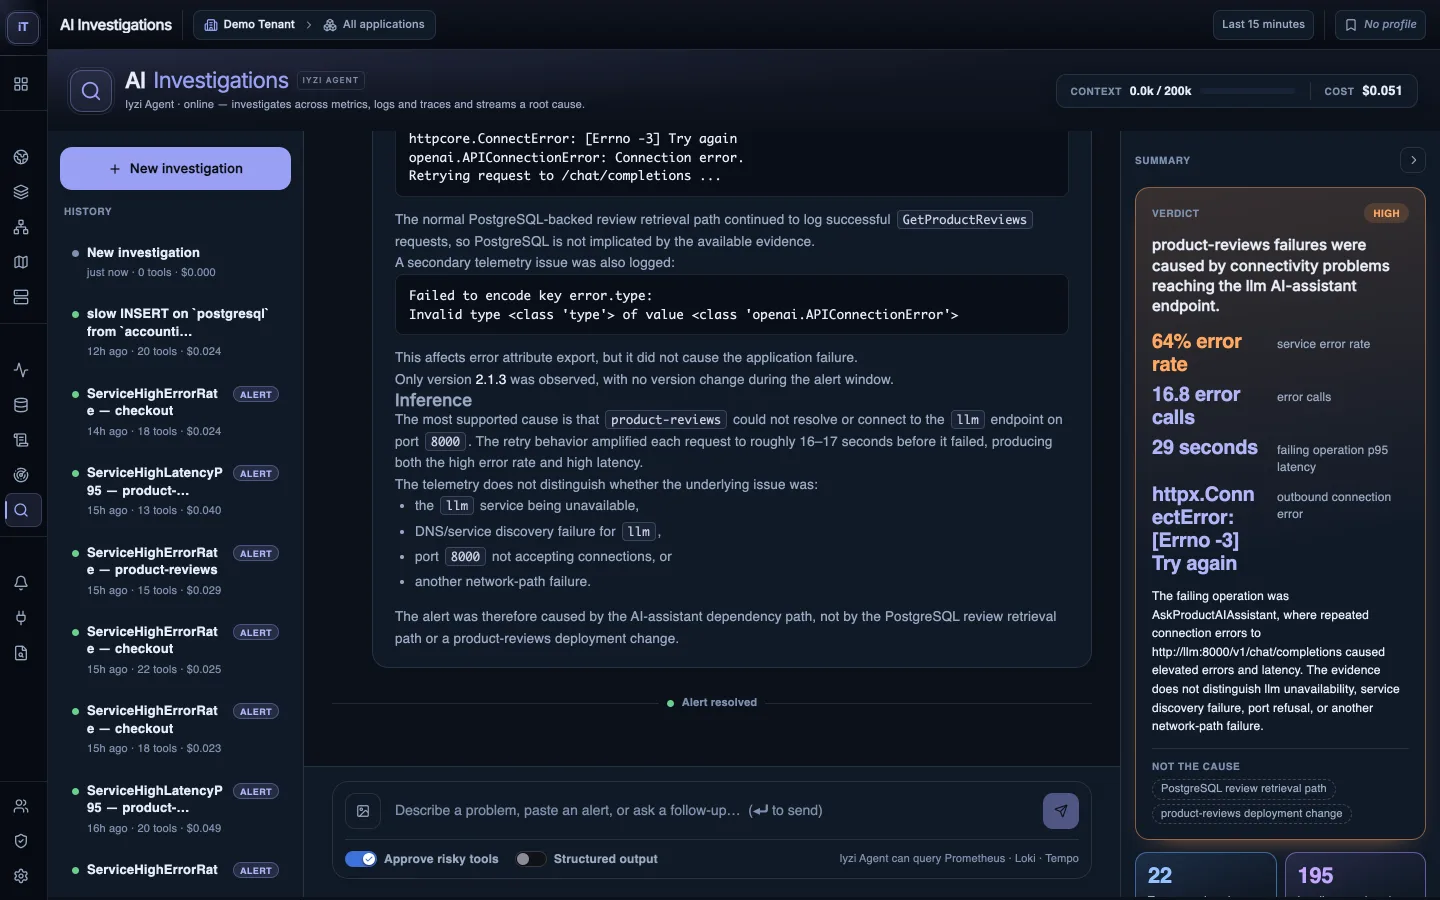
    AI Investigations reads traces, logs, metrics and service relationships together. It points to the likely root cause, the bottleneck and the exception patterns involved, and links each finding to the telemetry behind it so engineers can verify it.

    Your models, your AI strategy. Use your own AI provider and API credentials. Model choice, usage costs and data governance stay under your control.

    An AI investigation with its verdict, severity and the evidence behind it
  3. AI Agents & MCP

    From root cause to action, under your control

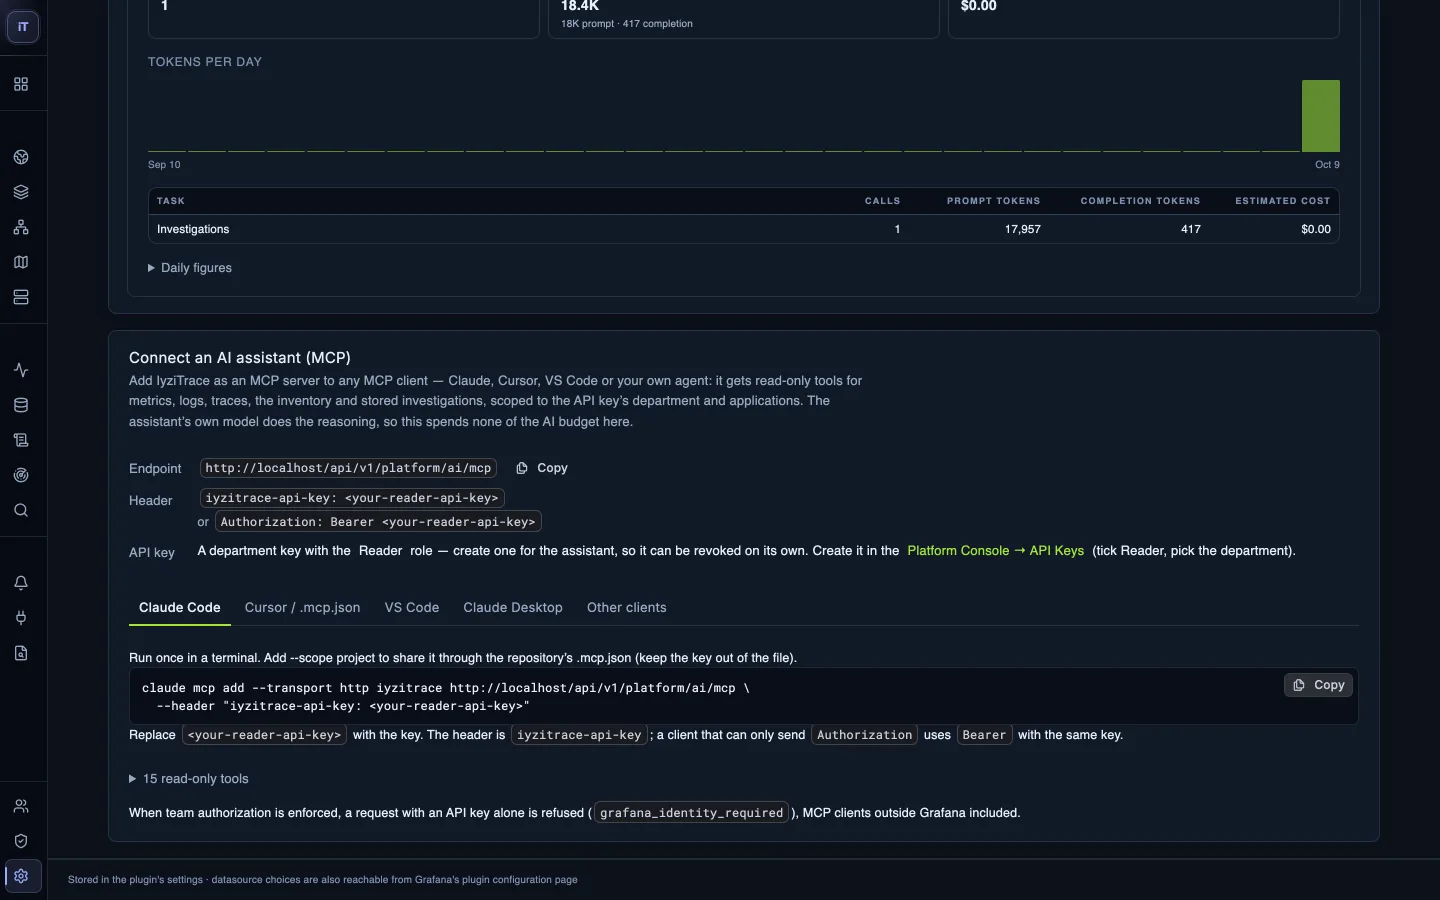
    Through Model Context Protocol (MCP) integrations, IyziTrace connects investigations to your external tools, operational platforms and enterprise systems. Agents can recommend an action, start an approved workflow or execute an authorized operation, then check fresh telemetry to confirm the result.

    You set the limits: every sensitive action runs through your authorization rules, tool permissions and approval controls.

    The MCP setup screen for connecting an AI assistant to IyziTrace
  4. Synthetic Journey Monitoring

    Protect the journeys that power your business

    Synthetic tests run your critical digital journeys around the clock:

    • Login and authentication
    • Product search and product details
    • Add to cart and checkout
    • Payment and order confirmation
    • Any other journey you configure

    Example: a synthetic checkout fails at the payment step. Engineers go straight to the services, API calls and dependencies behind that step. AI Investigations proposes the cause, and the response starts through your connected tools.

    A checkout journey that fails at the payment step

    1. LoginPassed
    2. SearchPassed
    3. CartPassed
    4. PaymentFailed
    5. ConfirmationNot reached
  5. Licensing

    Pricing you can forecast

    On-premises licensing counts active monitored nodes: physical servers, virtual machines and Kubernetes/OpenShift worker nodes. No matter how many cores, how much RAM or how many pods each node runs, it counts once.

    Example: a Kubernetes environment with 20 worker nodes, 64 CPU cores per node and 600 application pods needs 20 node licenses. SaaS is licensed by volume.

    See pricing
    worker nodes
    20
    CPU cores per node
    64
    application pods
    600
    20node licenses

How it works

Observe. Investigate. Act.

  1. 01

    Observe

    Collect traces, metrics and logs with OpenTelemetry SDKs, agents and Collectors, correlated with infrastructure and dependency context.

  2. 02

    Investigate

    AI points to the likely root cause and Nexus shows what else is at risk, each finding linked to its evidence.

  3. 03

    Act

    Start the response through your MCP-connected tools, then confirm the fix with fresh telemetry.

Why not just Grafana?

Built on Grafana. More than dashboards.

Grafana is a powerful foundation for metrics, logs, traces and alerting. Turning it into a complete APM means your team designs, builds and maintains the workflows, and keeps doing it.

IyziTrace ships that work finished: estate visibility, service placement, dependency impact, database and exception analysis, AI investigations, collector management, inventory context and enterprise authorization. Your team keeps the familiar Grafana foundation and skips the assembly.

The platform

Every module answers one question

Fourteen modules, one connected view of your applications and infrastructure.

ModuleThe question it answers
OverviewWhere in my technology estate does something need attention?
AtlasWhere does each application service run?
NexusIf this service fails, what else is at risk?
Service MapHow do my services communicate with one another?
ServicesWhich services are slow, failing or seeing abnormal traffic?
Trace PulseWhich distributed requests are behaving unusually?
SQL LensWhich database operations are slowing applications down?
Log StudioWhat do the related logs say about this incident?
Exception RadarWhich errors are new, increasing or recurring?
AI InvestigationsWhat is the likely root cause, and what is the evidence?
Agent ManagerHow are my OpenTelemetry collectors organized and configured?
Inventory Managementadd-onWhich infrastructure entities do I have, and how are they related?
AlertingWhich operational conditions need attention?
AuthorizationWho can access each application, team resource or capability?

Proof on your terms

Don't take our word for it. Test it on your systems.

Keep your current APM. Run IyziTrace alongside it on selected services, under real operating conditions, and compare:

  • Instrumentation coverage across your technology stack
  • Whether your engineers agree with the root causes AI Investigations finds
  • What Nexus reveals about dependencies and impact paths
  • Which MCP integrations and authorized workflows fit your operations
  • Synthetic monitoring of your most important business journeys
  • Commercial fit and total monitoring cost

Start small. Validate results. Scale with confidence.

Enterprise ready

Built for complex enterprise environments

IyziTrace is being adopted in retail, FMCG and banking, where application performance and operational visibility are critical.

  • On-premises deployment

    Telemetry stays in infrastructure you control. SaaS is available when you prefer a managed option.

  • Your AI credentials

    Customer-managed models and API keys support your internal governance rules.

  • Enterprise authorization

    Control access to applications, teams and platform capabilities.

  • Any infrastructure

    Physical servers, virtual machines, Kubernetes and OpenShift.

See what your current tools are missing.

Modernizing observability, speeding up incident investigation or evaluating operational AI: see IyziTrace on a live environment in 30 minutes, and plan a pilot on your own services.

Observe. Investigate. Act. From application performance to business outcomes.

Notes. Synthetic tests measure configured test journeys; real conversion rates, abandoned transactions and revenue impact require real-user or business-data integrations. Root-cause findings and dependency views depend on available telemetry. External AI services, MCP integrations and outbound connections are configured according to your security policies. Instrumentation coverage, especially for legacy systems, is validated during technical evaluation. Established APM vendors offer many comparable capabilities; features, editions and contracts vary.